
Numbers aren’t just numbers.
You launched your TikTok Shop, listed your products, ran a couple of boosted posts and maybe even caught a little wave of viral traffic.
But now you’re staring at your Seller Center feeling unseen with your shelves fully stocked but your sales non existent.
Views? Okay. Orders? Decent. Conversion rate? Confusing.
The problem isn’t the dashboard, it’s how we treat data like an accessory instead of a roadmap.
For most sellers, especially in the U.S, TikTok shop analytics can feel either overwhelming or, worse, irrelevant.
But the truth is, your analytics are not just a record of what happened, they’re a real-time map of where you’re headed and what needs fixing right now.
This article will walk you through how to read the numbers like a growth strategist, not a spectator.
Getting comfortable with the seller center dashboard
The TikTok Seller Center can feel like the dashboard of an airplane: a lot of blinking numbers, buttons and graphs.
But once you learn to read the gauges, you realize they’re all just telling you one thing: what your shop is doing right now.
Inside the dashboard, you’ll find your:
- Order volume and fulfillment status
- Product listings
- Return and cancellation rates
- Earnings and disbursements
- Performance score
- Traffic and engagement metrics
Did you know your seller Center dashboard is actually telling you a story?
Most people think it’s just where you go to check your orders or update product listings, but it’s so much more than that.
Every section on that dashboard is giving you clues about how your business is doing and what you can improve before small issues turn into big problems.
Let’s break it down.
If your pending orders section is filled with delays, it could be a sign that something’s off with your logistics or supplier flow.
Maybe deliveries are taking too long, maybe you need to follow up more often. Either way, this section is waving a little flag saying, “Hey, something needs your attention here!”
Now, what about your Performance Score?
This isn’t just a number TikTok puts there for decoration. It reflects things like how quickly you respond to customers, how often your orders get canceled or how reliable your delivery times are.
TikTok uses that score to decide whether or not to recommend your products to buyers, so keeping it high matters a lot.
And here’s something many sellers overlook, your cancellation and refund rates are actually messages from your customers telling you something without saying a word.
Ask yourself these questions:
- Are people canceling orders before they even ship out? That might mean your delivery window feels too long or they’re losing interest because they don’t know when to expect their item.
- Are refunds piling up? That’s usually a red flag that your product listings might not match the reality of what’s being delivered whether it’s the size, color or even quality.
Your dashboard isn’t just a tool. It’s your behind-the-scenes business partner. It helps you see what’s working, what’s not and what your customers may be feeling, but not directly telling you.
So don’t ignore it, check in often, read the signs, tweak what needs fixing.
Because the seller center isn’t just for admin tasks it’s your reputation manager, sales coach and business planner all in one place.
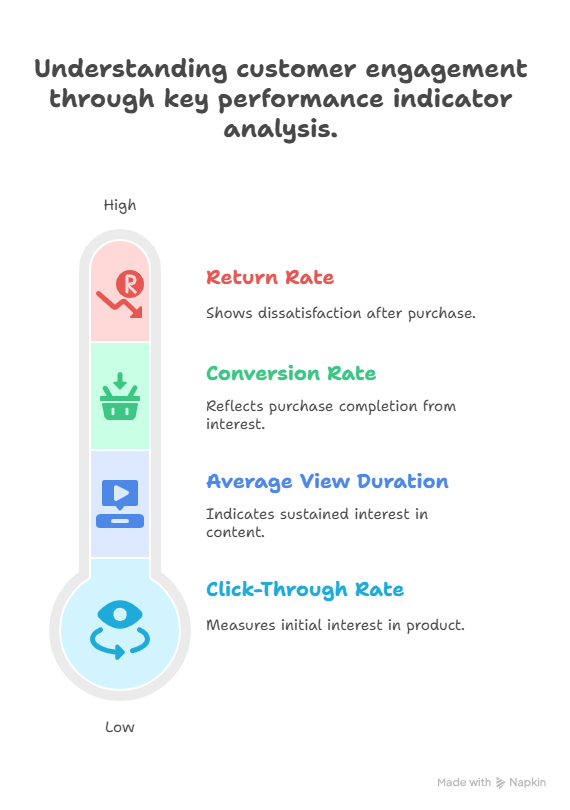
Top 4 key performance indicators
Here are the core KPIs (Key Performance Indicators) you should track daily or weekly. They don’t just show how your business is performing, they help you identify why.
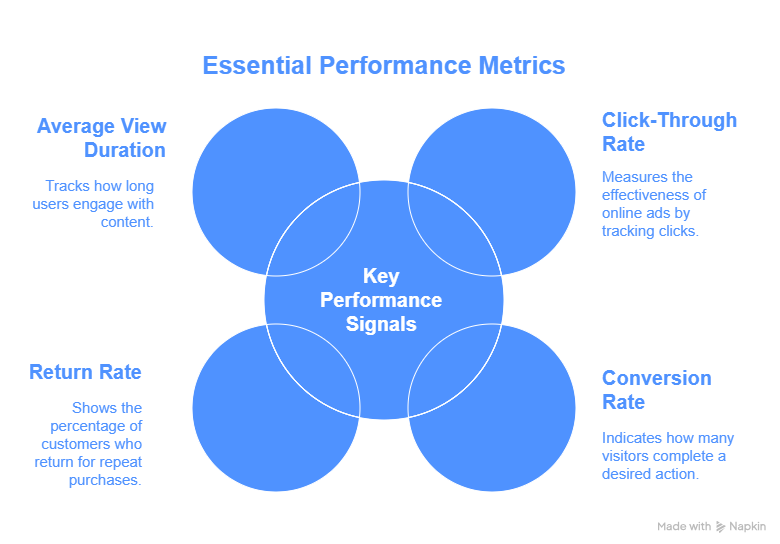
1. Click-through rate (CTR)
Are people interested enough to even check your product out?
You could be getting tons of views but if nobody’s clicking, it means your video didn’t stop the scroll. That tells you one thing, something isn’t grabbing attention.
So what could be off?
Your hook may not be strong enough in those crucial first 2 seconds, maybe your caption isn’t clear, catchy or keyword-rich or your thumbnail just doesn’t make someone go, “Ooh, what’s this?”
This is how you fix it:
Start your video with something unexpected or relatable. Think: “You won’t believe what fits in this bag…”, use captions that spark curiosity or urgency like “Last day to grab this!”
Show clear value right away. Example: “This bag fits your entire day and still looks classy.”
The goal here? Make people want to know more, that’s how you make more clicks happen.
2. Conversion rate
Are those clicks turning into actual purchases?
If your traffic is high but sales are low, people are interested but something is stopping them from completing the order.
Let’s look at what might be going wrong:
Product images that don’t really sell the lifestyle or look a bit dull, descriptions that sound vague or overly generic, no reviews or social proof, so buyers don’t feel confident or maybe the price feels too high for what they’re seeing
Here’s what you can do:
Write descriptions that speak clearly and highlight benefits, not just what the product is, but what it does for the buyer.
Use lifestyle imagery that shows the product in real use, not just flat lay photos or white backgrounds, add urgency with simple CTAs like “Only 7 left!” or “10% off until midnight!”, encourage reviews and use them in your product page visuals.
3. Return rate
If you notice a recurring pattern of returns, it’s important not to overlook it, as it may indicate that something is not meeting customer expectations.
Consider whether the sizing of your products is inconsistent, if there might be an issue with overpromising on quality or if your products differ from what is shown in your marketing materials.
To address these concerns effectively, you can implement detailed sizing charts and provide genuine photos of the products. Including customer reviews that share actual usage stories can also enhance trust.
Additionally, creating video demonstrations showcasing the real scale and function of your products can help clarify any misunderstandings and improve customer satisfaction.
4. Average view duration
Are people sticking around to watch your content or are they scrolling away before you even get started?
On TikTok, attention is everything and if users are swiping past your video within seconds, it’s not just a lost view, it’s a signal to the algorithm that your content isn’t engaging enough.
So what’s the issue?
Usually, it’s the beginning of your video, If the first few seconds don’t spark curiosity, emotion or interest, people won’t stay and TikTok won’t push it.
Here’s how to hold their attention from the start
Open with a punchy line that instantly hooks the viewer. Example: “This one thing changed how I pack forever”, use quick cuts, bold text or dynamic transitions to keep the energy up, show the product in action right away, don’t wait till the end to reveal the good part
Think of your video like a conversation with a stranger. If your first sentence doesn’t spark interest, they’re gone. Fast.
One last thing to remember
Average view duration isn’t just a metric, it’s a mirror. It shows you exactly how engaging your content is in real time, It’s not just data, It’s how your audience feels.
Pay attention, adjust and experiment. The more value you bring in those opening seconds, the more TikTok brings your video to new eyes.
Using data to adjust strategy
Let’s say one of your videos gets 30,000 views but only 100 clicks, that’s a CTR of 0.3%. Now compare that to another video with 5,000 views and 200 clicks at 4% CTR. The second one is your winner, even if it seems “smaller.”
TikTok success is about effectiveness, not just exposure.
Common performance issues in TikTok shop and how to turn them around
Low conversion rate?
Your CTA might not be strong enough. Improve your CTA, experiment with “Order before midnight” or “Get yours before it sells out again.”
High return rate?
Include screenshots of customer reviews, show video testimonials. Mention, “Accurate sizing” or “Order one size up” if necessary.
Low average view duration?
You’re losing people early, try funny skits, a dramatic reveal or use TikTok’s trending storytelling formats like “3 things I wish I knew before…”
Steady traffic spikes?
Reverse-engineer your top performing posts. What time were they posted? What song was used? What type of hook was used in the first 3 seconds?
Understanding TikTok-Specific Behavior
Here’s the deal, TikTok is not Amazon. It’s not about who has the best price, it’s about who tells the best story.
Factors that influence your analytics
Trending audio
Popular sounds can boost your visibility, but make sure the mood fits your product. A playful song might attract the wrong demographic if you’re selling premium home decor.
Post timing
Consider A/B testing different post times to see what drives the most engagement. Does your audience respond better at 9 AM, 3 PM, or 8 PM? Canadian audiences might prefer lunch or late night scrolls, while U.S. shoppers may engage more on weekend mornings.
Content style
Compare story-style posts vs. direct product showcases. One might perform better for your niche. Example: “How I styled this $15k shirt for 3 occasions” vs. “New drop. Get this luxury shirt now.”
Engagement format
Try using comments as content: “Someone asked if this bag can carry a laptop… Here’s the answer.”
Your analytics won’t give you definitive answers, but they will help you ask smarter questions. Every post is a test. Every metric is feedback.
Outside the seller center
While TikTok Seller Center is your central hub, don’t stop there.
Here are extra tools that help make sense of the bigger picture:
Google sheets or excel
Manually track sales, video views, CTR and returns weekly or monthly. It helps you see long-term trends and seasonality.
Notion or airtable
Use these to document what content format, audio, caption style or time of day worked best. Think of it like a content lab.
Heatmap & analytics tools
If you run external stores or link to external websites, use heatmaps to track how far people scroll and where they click.
Poll stickers in TikTok videos
Directly engage with your audience. Ask “Would you wear this?” or “Which one should we restock first?” The responses not only improve engagement, but provide valuable data you can act on.
Data Is a tool, not a judgment
One thing many sellers overlook, your analytics dashboard isn’t there to criticize you, it’s there to guide you.
The numbers you see aren’t personal, they’re practical, they’re signals you can use to improve not labels to fear.
You don’t need to be a data expert to use this tool well. What you need is the willingness to look closer and to ask the right questions.
Here’s a good place to start:
- Open your dashboard and choose one data point that stands out
- Ask: “What could this number be telling me?”
- Then consider: “What small change can I test to influence this?”
You’re not expected to fix everything at once. Just observe, adjust and apply over time, the patterns will become clearer and so will your path to better performance.
The goal isn’t perfection. It’s progress.
The TikTok Seller Center might look like a numbers maze, but once you master it, it becomes your greatest strategic weapon.
What is your role in all of these?
Start treating your numbers like your business partner. Open your Seller Center today, find one insight and make one change. That’s how you grow.
You’re already putting in the work, let’s fine-tune your approach with a personalized consultation.
Book a Consultation